Oppo K13 Turbo Review

Consensus Review · 33 independent sources
Oppo K13 Turbo
You'll notice the Oppo K13 Turbo is a powerhouse for gaming and daily multitasking, thanks to its top-tier performance and massive battery. While it excels at staying powered and cool, you should watch out for the underwhelming camera and short software support. It's a solid pick if you prioritize speed and stamina over professional-grade photography.
👍 Oppo K13 Turbo pros and cons
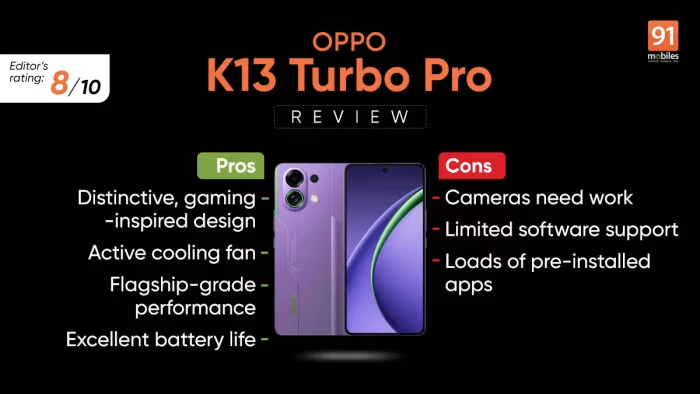
👍 Pros
- Long battery life
- Smooth multitasking performance
- Premium finish build Quality
- Extreme performance gaming
- Stereo speakers
👎 Cons
- Two years updates
- Below average camera
- Coloros 15 software & AI
- Basic dual-camera setup lacks an ultrawide lens
- Heating issues and heavy throttling during sustained
🎯 Who This Product Is For
Reviewer recommendations for different target audiences and use cases.
💰 Value for Money Analysis
You get a lot of speed for your money here, making it a good value if you want a dedicated gaming device on a budget.
26 of 33 sources commented on price or value.
📊 What Reviewers Say — Feature by Feature
12 features discussed across 33 sources. Each score blends what reviewers said about that feature with the overall score, so a feature with few mentions stays close to the overall verdict.
🔀 Rivals to compare
- Poco F7 (named by 7 of 33) [rival, cheaper] competitor with better camera systems and longer software support Offers better throttling management without a physical fan and longer software support. Reviewers favoured it for camera. Reviewers favoured Oppo K13 Turbo for battery, cooling, gaming.
- iQOO Neo 10 (named by 5 of 33) [rival, cheaper] Provides a more balanced package with an ultrawide camera. Offers similar FPS at a lower price. Reviewers favoured Oppo K13 Turbo for design, efficiency.
- OnePlus Nord 5 (named by 3 of 33) [rival] Outperformed by the Oppo in battery endurance. Performance competitor around Rs 30,000 Reviewers favoured Oppo K13 Turbo for battery, performance.
- iQOO Neo 10R (named by 3 of 33) [rival] Performance competitor around Rs 30,000 Offers great gaming capabilities but lacks the massive battery and feature-rich ColorOS. Reviewers favoured Oppo K13 Turbo for performance.
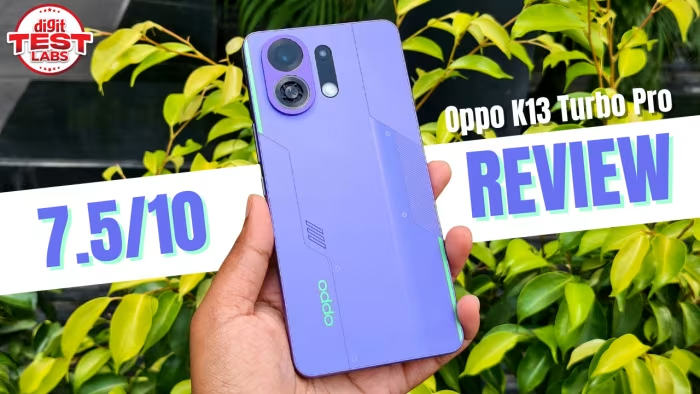
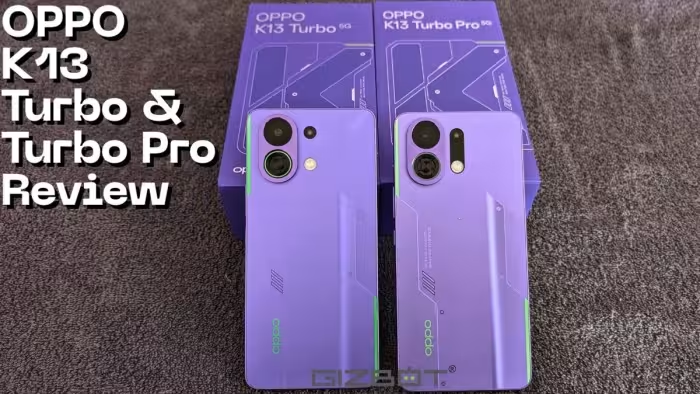
- OPPO K13 Turbo Pro (named by 2 of 33) [premium] Offers a Snapdragon chip and RGB lighting. Offers an upgraded Snapdragon 8s Gen 4 chipset and RGB lighting.
Reasons are the reviewers' own. Spellings of the same product are merged.
🔧 Key Specifications
Specifications as listed on versus.com. Verify with the manufacturer for complete details.
- Processor: MediaTek Dimensity 8450
- Battery: 7,000 mAh
- Main camera: 50 & 2 MP
- Display type: LCD, IPS
- Refresh rate: 120Hz
- Wired charging: 80W
- Android version: Android 15
- Dust and water resistance: IP67
- Weight: 207 g
- Brightness: 600 nits
- Screen size: 6.8"
- Resolution: 1280 x 2800 px
- RAM: 12GB
- Storage: 512GB
🛒 Is it right for you?
✅ Buy this if…
- You're a dedicated mobile gamer.
- You want top-tier performance for gaming.
- You're looking for a great display and battery life.
- You need reliable all-day battery life from a 7000 mAh capacity.
⚠️ Skip this if…
- You want long-term software update support.
- You require a high-end camera setup.
- Your top priority is professional photography.
- You're a photography enthusiast looking for versatile camera lenses.
⚖️ Rivals compared on specs
Closest on paper
- Oppo F31 Pro Plus 5G (98% spec match) versus.com score 59/100.
- Oppo Reno15 FS 5G (98% spec match) versus.com score 58/100.
- Oppo A6 Pro (China) (97% spec match) versus.com score 57/100.
- Oppo Reno15 F 5G (97% spec match) versus.com score 57/100.
- Oppo Reno15c 5G (97% spec match) versus.com score 57/100.
- Oppo F31 Pro 5G (96% spec match) versus.com score 60/100.
vs Oppo K13 Turbo Pro (named by 2 of 33 reviews, 91% spec match)
| Spec | Oppo K13 Turbo | Oppo K13 Turbo Pro |
|---|---|---|
| Screen size | 6.8 in | 6.8 in |
| Refresh rate | 120 Hz | 120 Hz |
| Battery | 7,000 mAh | 7,000 mAh |
| Wired charging | 80 W | 80 W |
| Weight | 207 g | 208 g |
| Main camera | 50 MP | 50 MP |
| Brightness | 600 nits | 600 nits |
No spec data yet for: Poco F7, iQOO Neo 10, OnePlus Nord 5, iQOO Neo 10R.
Figures are manufacturer specifications from versus.com. Spec match compares RAM, storage, screen, battery, charging, weight and similar numbers. It says how alike two phones are on paper, not which one is better. A ✓ marks the better value.
Real-world findings
Test results, marketing claims and known problems
🔍 Claims vs real life
| Claim | Claimed | Measured by reviewers | Verdict |
|---|---|---|---|
| Display Brightness | 1,600 nits | 1,770 nits (one review) [India] | Beats the claim |
| Battery Life | 7,000 mah | 7,000 mah (one review) [India] | Holds up |
| Size & Weight | 208 grams | 207 grams in all 2 reviews [India] | Holds up |
| Camera | 16 mp | not measured | Not independently tested |
| Depth Sensor | 2 mp | not measured | Not independently tested |
| Display | 6.8 inch | not measured | Not independently tested |
| Primary Sensor | 50 mp | not measured | Not independently tested |
| Thickness | 8.31 mm | not measured | Not independently tested |
Claims are the manufacturer's figures as quoted by reviewers. Measured values are what reviewers recorded themselves; test conditions differ between sources.
🔋 Real-World Battery
| Measurement | Result |
|---|---|
| Battery Life | 6.7–17 h across 3 reviews. Results vary a lot, probably because the tests differ [India] |
| Battery Life (drain) | 2.5–5% across 3 reviews. Results vary a lot, probably because the tests differ [India] |
| Battery Life | 7,000 mah (one review) [India] |
| Battery Life | 1.75 days (one review) [India] |
⚠️ Things to Check Before Buying
- Water Resistance: reviews disagree (yes vs no), so check the exact version you are ordering.
- Not included: Dust Resistance, Expandable Storage, Ultrawide Camera.
- Confirmed by reviewers: Charger In Box, NFC, Stereo Speakers, Bypass Charging, Cooling Fan, Infrared sensor.
⚠️ Known problems
Confirmed by 2+ sources
- Only two years of guaranteed OS updates (moderate · unresolved · 3 sources)
- Lack of dust protection (moderate · unresolved · 2 sources)
- Low-light performance is average with noticeable noise and limited dynamic range (moderate · unresolved · 2 sources)
Reported by one source (not confirmed)
- Heating issues and heavy throttling during sustained heavy load (major · unresolved · 1 source)
- Heavy throttling in stress tests (major · unresolved · 1 source)
- Poor camera performance and pixelated images in daylight compared to rivals (major · unresolved · 1 source)
- Absence of OIS causes handheld shots to suffer in low light (moderate · unresolved · 1 source)
- Absence of an ultrawide lens (moderate · unresolved · 1 source)
- Comes with a lot of pre-installed bloatware (moderate · unresolved · 1 source)
- Crushed shadows and unnatural skin tones (moderate · unresolved · 1 source)
How it compares
Alternatives and the previous model
The Oppo K13 Turbo is a strong choice for gamers who want top-tier performance, though you'll have to accept compromises in camera versatility and long-term software support.
Most-named alternative: Poco F7 (named by 7 of 33 sources)
Nerd corner
Feature-by-feature chart, measurements, specs and the score maths. Skip this part if you only want the answer.
Technical note: Reviewers measured Geekbench 6 multi-core scores between 5,975 and 6,079, indicating consistent performance under load. While the active cooling fan provides a temperature reduction of 8 to 10 °c, some sources noted heavy thermal throttling during stress tests.
⚙️ Speed and Benchmarks
| Measurement | Result |
|---|---|
| Average FPS | 89.4–90 fps across 2 reviews [India] |
| Geekbench 6 multi-core | 5,975–6,079 across 2 reviews [India] |
| Geekbench 6 single-core | 1,413–1,424 across 2 reviews [India] |
| Geekbench Multi-Core Score | 5,984–6,012 across 2 reviews [India] |
| Geekbench Single-Core Score | 1,436–1,996 across 2 reviews. Results vary a lot, probably because the tests differ [India] |
| multi-core score | 5,885–6,744 across 2 reviews [India] |
| single-core score | 1,443–2,152 across 2 reviews. Results vary a lot, probably because the tests differ [India] |
🖥️ Screen Tests
| Measurement | Result |
|---|---|
| screen-on time | 7–17 h across 4 reviews. Results vary a lot, probably because the tests differ [US, India] |
| Display Brightness | 1,770 nits (one review) [India] |
🌡️ Heat and Sustained Speed
| Measurement | Result |
|---|---|
| temperature reduction | 8–10 °c across 3 reviews [India] |
| BGMI temperature | 38.05 °c (one review) [India] |
| CPU throttle peak performance percentage | 77% (one review) [India] |
| CPU throttling | 77.5 percent (one review) |
🔬 Technical takeaway
- Charge time: 42–70 minutes across 4 reviews. Results vary a lot, probably because the tests differ [India].
- Screen-on time: 7–17 h across 4 reviews. Results vary a lot, probably because the tests differ [US, India].
- Battery Life: 6.7–17 h across 3 reviews. Results vary a lot, probably because the tests differ [India].
- Battery Life (drain): 2.5–5% across 3 reviews. Results vary a lot, probably because the tests differ [India].
- Check before ordering: Water Resistance differs between reviews.
Numbers come from the reviewers' own tests and spec lists. Test conditions differ between sources.
⚡ Where Reviewers Disagreed
- charge time: 42–70 minutes across 4 reviews. Results vary a lot, probably because the tests differ Test conditions differ: charging from empty to full with 80W SUPERVOOC charger; 80W SuperVOOC charging; full charge.
- screen-on time: 7–17 h across 4 reviews. Results vary a lot, probably because the tests differ Test conditions differ: mix of gaming, YouTube streaming, music playback, and scrolling through Instagra; screen on time across charge cycles; PC Mark Battery Life test.
- Battery Life: 6.7–17 h across 3 reviews. Results vary a lot, probably because the tests differ Test conditions differ: from 20 to 100 percent; video playback; PCMark battery test.
- Battery Life (drain): 2.5–5% across 3 reviews. Results vary a lot, probably because the tests differ Test conditions differ: every 30 minutes; TDM Match Battery Drain; 15 minutes of BGMI.
- Geekbench Single-Core Score: 1,436–1,996 across 2 reviews. Results vary a lot, probably because the tests differ Test conditions differ: Geekbench Single-Core; fan to its maximum.
- single-core score: 1,443–2,152 across 2 reviews. Results vary a lot, probably because the tests differ Test conditions differ: Geekbench; Geekbench 6 single-core test.
- Water Resistance: Sources state different values: yes (13), no (1). Depends on the configuration.
🧩 Other Things Reviewers Mentioned
Charge Time (5 of 33 sources)
| Measurement | Result |
|---|---|
| charge time | 42–70 minutes across 4 reviews. Results vary a lot, probably because the tests differ [India] |
Size & Weight (4 of 33 sources)
| Measurement | Result |
|---|---|
| weight | 207 grams, and all 2 reviews agree [India] |
BGMI frame rate (2 of 33 sources)
| Measurement | Result |
|---|---|
| BGMI frame rate | 115–120 fps across 2 reviews [US, India] |
Antutu Score (2 of 33 sources)
Burnout score (2 of 33 sources)
| Measurement | Result |
|---|---|
| Burnout score | 43.9–44.7% across 2 reviews [India] |
Frame Rate (2 of 33 sources)
| Measurement | Result |
|---|---|
| frame rate | 100–107 fps across 2 reviews [India] |
🧮 How We Got This Score
In short: each of the 33 reviews is turned into a 0 to 10 number, stronger evidence counts for more, and the numbers are averaged.
- 11 reviews gave their own numeric score, and those count extra. The others are scored from their overall tone.
- First impressions and reviews without hands-on testing count less.
- If 80%+ of reviews lean the same way, the score moves by 0.5. This time: 0 (no direction reached 80% agreement).
- 76% of reviews lean positive, and scores are close together (spread 1.3). Agreement: Moderate.
- How we got there: score 7.6/10, value signal 6.6/10 from 26 reviews, evidence strong (33 reviews, 31 hands-on).
- Reviews are dated Aug 2025 to Nov 2026.
The arithmetic, for the curious
| Review type | Reviews | Avg value | Total weight | Value × weight |
|---|---|---|---|---|
| Numeric reviewer score | 11 | 7.8 | 16.05 | 125.78 |
| Strongly positive review | 8 | 8.5 | 8.00 | 68.00 |
| Mildly positive review | 7 | 7.5 | 7.00 | 52.50 |
| Mixed review | 7 | 5.0 | 3.50 | 17.50 |
| All reviews | 33 | 34.55 | 263.78 |
Raw average = 263.78 ÷ 34.55 = 7.6. Consensus adjustment 0 gives the final 7.6.
Calculated in code from structured data, with no manual adjustments.
How much to trust this
What these conclusions are based on
Based on 33 usable reviews: 31 hands-on, 1 first impressions, 11 with a numeric score, 19 with measured results. Evidence strength: strong.
Versions covered: 8 GB RAM, 256 GB Storage; 12GB RAM; 256GB; 12GB + 256GB; 8GB RAM and 128GB storage; 8GB RAM, MediaTek Dimensity 8450. Reviews used different storage sizes and colours. That doesn't change the verdict, but check the one you're buying.
Reviewer recommendations: 20 recommended, 7 conditional, 0 not recommended.
How sources were chosen: every matching review in our collection is used, newest first.
No source rated it negatively, so the weak spots listed on this page are where the real differences show up.
Reviewers who gave a numeric score averaged 7.8/10, ranging from 6.0 to 9.0.
📚 Sources Analysed
All 33 reviews were matched to 27 different sites.
Reviews by market: India 24 · US 1 · 8 without a stated market. Prices, mileage and range figures follow each reviewer's own market.
Last updated: 16 Nov 2026 · based on 33 reviews dated Aug 2025 – Nov 2026.