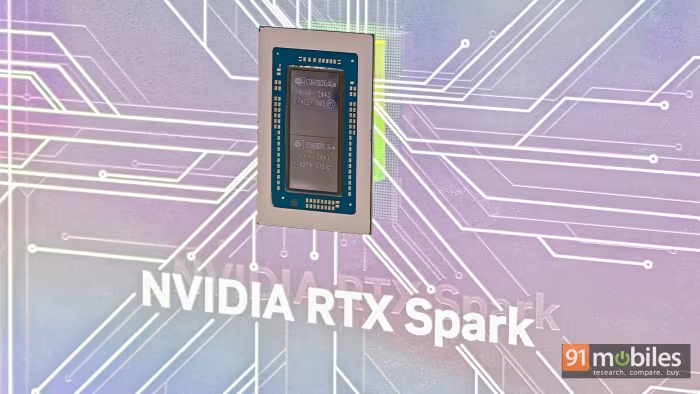
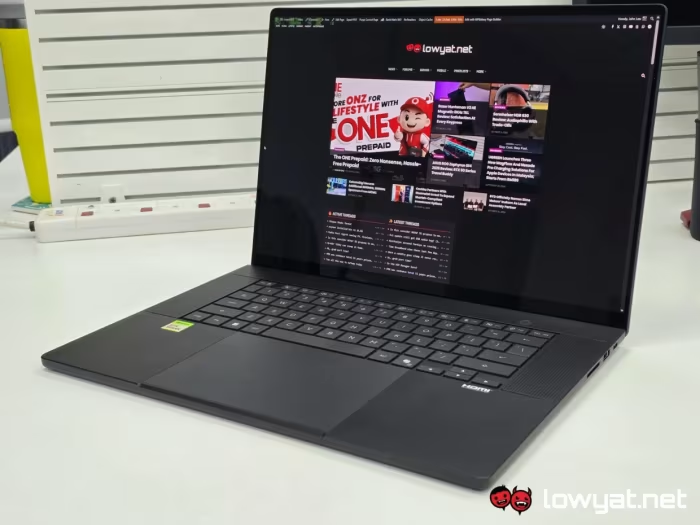
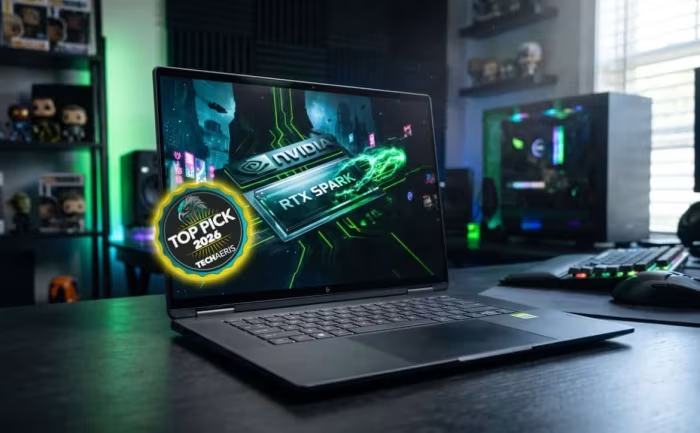
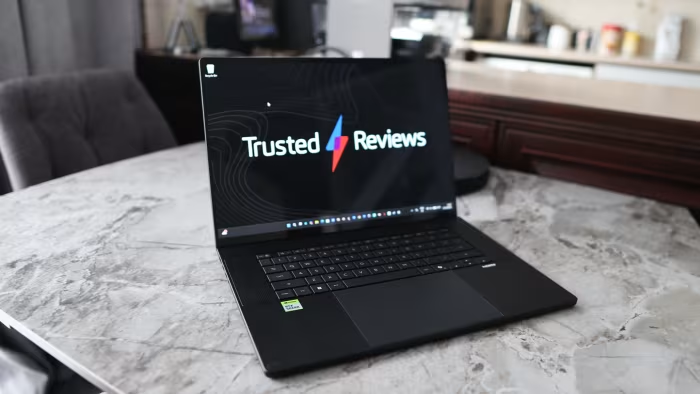
NVIDIA RTX Spark Review
Consensus Review · 25 independent sources
NVIDIA RTX Spark
Highly rated. Reviewers love how it performs, though many find the price steep.
⚡ The Short Version
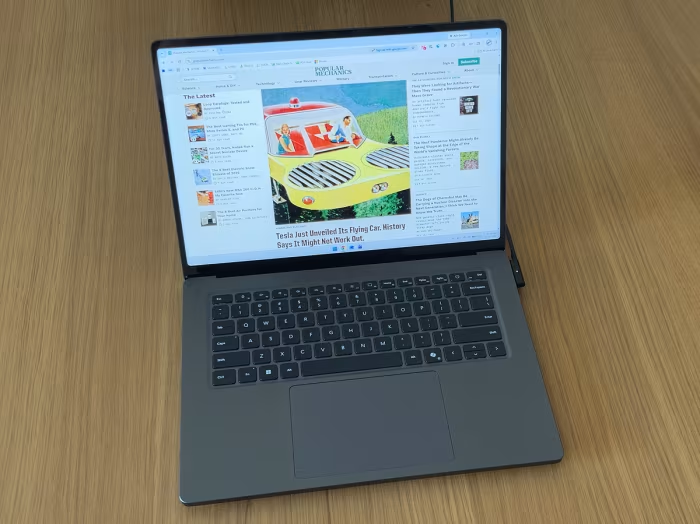
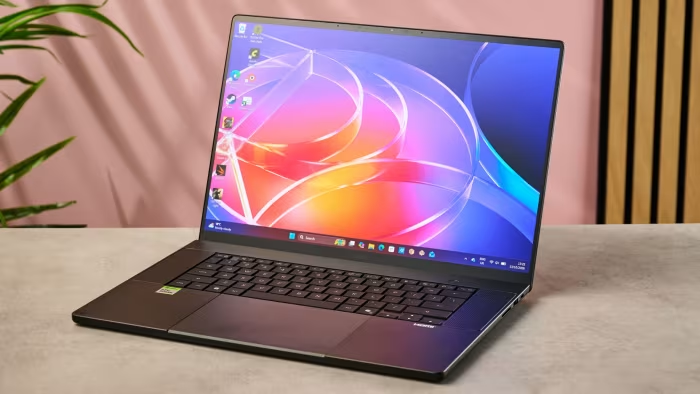
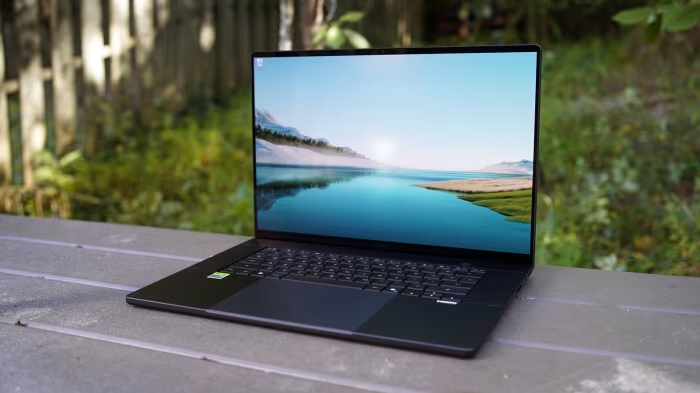
The RTX Spark is a powerhouse for creative work and local AI tasks, packing impressive performance into a sleek, portable frame. You'll enjoy a stunning Tandem OLED display, comfortable keyboard, and top-tier speakers that sound clear and deep. It's quite pricey for what you get, so it's a better fit if you need that specific creative power rather than just a general-purpose laptop.
Things to weigh: Value for Money (reviewers disagree) · Webcam (reviewers disagree)
Reviews by market: US 16 · 9 without a stated market. Prices, mileage and range figures follow each reviewer's own market.
Confidence: high · 25 reviews · 25 hands-on
👍 NVIDIA RTX Spark pros and cons
👍 Pros
- Great depth speakers
- Local ai ai Npu
- Beautiful chassis design
- Rtx spark performance
- Tandem oled display
👎 Cons
- 1080p webcam
- App compatibility software & Features
- Heavy laptop weight & Portability
- Expensive configurations
- App compatibility and translation overhead on Windows
💰 Value for Money Analysis
Reviewers generally find this laptop overpriced, noting that it costs as much as dedicated gaming or professional creative machines.
23 of 25 sources commented on price or value.
📊 What Reviewers Say — Feature by Feature
14 features discussed across 25 sources. Each score blends what reviewers said about that feature with the overall score, so a feature with few mentions stays close to the overall verdict.
🔀 Rivals to compare
- Apple MacBook Pro (named by 4 of 25) [rival] Avoids Windows on ARM compatibility issues and offers better value. Popular alternative for power users, though top configurations cost significantly more.
- HP OmniBook Ultra 16 (named by 4 of 25) [rival] Offers slightly higher multi-threaded performance and faster Gen5 storage options. Offers a 20-core chip and Gen5 storage but runs warmer. Reviewers favoured it for multicore. Reviewers favoured NVIDIA RTX Spark for performance, efficiency.
- Lenovo Yoga 9n 2-in-1 16 (named by 4 of 25) [rival] Similar memory and hardware configuration in a slightly lighter body. Provides 64GB memory configuration for larger local AI models.
- Razer Blade 16 (named by 4 of 25) [rival] Features an RTX 5090 GPU for heavier x64 gaming and performance. Stands in for the x64 field with an RTX 5090. Reviewers favoured it for gaming. Reviewers favoured NVIDIA RTX Spark for display, multicore.
- Apple M5 (named by 3 of 25) Reviewers favoured it for efficiency. Reviewers favoured NVIDIA RTX Spark for multicore, performance.
- Apple MacBook Pro (M5 Max) (named by 3 of 25) [premium] Delivers desktop-class power in a 14-inch form factor. Reviewers favoured it for multicore. Reviewers favoured NVIDIA RTX Spark for performance.
- Apple MacBook Pro 16 (named by 3 of 25) [rival] Comparable high-end creative power with superior battery life, though similarly expensive. Offers better overall Mini-LED implementation and longer battery life.
- Asus ProArt P16 (named by 3 of 25) [rival] Another Spark laptop featuring dual-sided USB-C ports and full-sized SD reader. Thinner, lighter, and features a superior OLED panel.
Reasons are the reviewers' own. Spellings of the same product are merged.
🛒 Is it right for you?
✅ Buy this if…
- You want serious graphics and local AI power in a thin and light laptop.
- You need sustained high performance in a thin chassis.
- You want an exceptional Tandem OLED display and full port selection.
- You prioritize repairability with easy top-access serviceability.
⚠️ Skip this if…
- You're on a tight budget.
- You're watching your budget and don't need extreme AI power.
- You require the fastest possible Gen5 storage speeds at lower price points.
- You only need a laptop for general productivity or gaming.
Is the NVIDIA RTX Spark worth buying?
Strengths, weaknesses and who it suits
🎯 Who This Product Is For
Reviewer recommendations for different target audiences and use cases.
Real-world findings
Test results, marketing claims and known problems
🔍 Claims vs real life
| Claim | Claimed | Measured by reviewers | Verdict |
|---|---|---|---|
| Battery Life | 17 h | 9.75–95 h (typically 13.75) across 9 reviews [US] | Falls short |
| Display Brightness | 1,050 nits | 550–1,600 nits (typically 944) across 7 reviews [US] | Falls short |
Claims are the manufacturer's figures as quoted by reviewers. Measured values are what reviewers recorded themselves; test conditions differ between sources.
🔋 Real-World Battery
| Measurement | Result |
|---|---|
| Battery Life | typically 12.88 h (9.75–17 across 8 reviews). Results vary a lot, probably because the tests differ [US] |
| Battery Life (drain) | 1–86% across 3 reviews. Results vary a lot, probably because the tests differ |
| Battery Life | 90 mins (one review) |
| Battery Life | 9.97 hours and mi (one review) |
⚠️ Things to Check Before Buying
- These reviews cover different versions (20-core Grace CPU, Blackwell integrated GPU, 32GB unified memory, 1TB SSD; 20-core N1X, 64GB LPDDR5X-9400, 1TB Gen4 SSD; 18 core Nvidia N1X processor, 32GB unified memory, 512GB SSD), so check which one you are buying.
- Confirmed by reviewers: Headphone Jack, Expandable Storage, Touchscreen, SD Card Reader, Webcam, Audio Jack.
⚠️ Known problems
Confirmed by 2+ sources
- App compatibility and translation overhead on Windows on Arm (moderate · unresolved · 2 sources)
Reported by one source (not confirmed)
- Crashes and more noticeable stutters on our launch drivers when running modern titles (major · unresolved · 1 source)
- Inconsistent anti-cheat game compatibility (major · unresolved · 1 source)
- VALORANT remains unplayable due to Riot Vanguard (major · unresolved · 1 source)
- 4K60 video playback tends to stutter (moderate · unresolved · 1 source)
- Can get toasty, reaching 110 degrees Fahrenheit on keyboard and bottom (moderate · unresolved · 1 source)
- Display on my unit has this habit of suddenly dimming and going dark at times (moderate · unresolved · 1 source)
- Fans have the capacity to get quite loud (moderate · unresolved · 1 source)
- Gets hot under the hinge when running flat out and plugged in (moderate · unresolved · 1 source)
- Meh battery life (moderate · unresolved · 1 source)
How it compares
Alternatives and the previous model
🔄 Worth Upgrading?
3 of 25 sources compared it directly with the Asus ProArt P16 (2025).
- Swaps discrete graphics and CPU package for Nvidia's RTX Spark
- Slimmer and lighter chassis
- Improved PWM frequency on the display
- Nvidia RTX Spark N1X chip instead of previous AMD/Intel setup
- Removal of integrated dial-pad on the touchpad
- thinner and lighter form factor
- longer battery life
Only 1 reviewer gave a clear upgrade verdict (1 say upgrade), too few to call it either way.
Reviewers conclude the RTX Spark is a powerful, premium workstation for creators, though its high price and software compatibility hurdles make it a niche pick rather than a general-purpose machine.
Most-named alternative: Apple MacBook Pro (named by 4 of 25 sources)
Nerd corner
Feature-by-feature chart, measurements, specs and the score maths. Skip this part if you only want the answer.
Technical note: Performance is consistent, with 3DMark Time Spy scores ranging from 10,164 to 11,840. Battery life varies significantly between tests, with US reviewers measuring plenty of 9.75 to 17 hours.
⚙️ Performance
| Measurement | Result |
|---|---|
| 3DMark Time Spy | 10,164–11,840 across 3 reviews |
| Cinebench 2026 Steady state / first pass | 1–1.01 across 2 reviews [US] |
| Cinebench 2026 multi-core | 6,631–6,963 points across 2 reviews [US] |
| Cinebench 2026 single-core | 558.5–564.5 points across 2 reviews [US] |
| Cinebench R23 multi core | 14,650–16,762 across 2 reviews |
| Cinebench R23 single core | 1,306–1,323 across 2 reviews |
| Geekbench 6 multi core | 19,171–19,313 across 2 reviews |
| Geekbench 6 single core | 3,003–3,085 across 2 reviews |
| SSD read speed | 7,218–7,300 mb/s across 2 reviews |
| SSD write speed | 5,422–5,778 mb/s across 2 reviews |
🖥️ Display
| Measurement | Result |
|---|---|
| Display Brightness | typically 944 nits (550–1,600 across 7 reviews). Results vary a lot, probably because the tests differ [US] |
| Display Brightness | 435–1,059 cd/m² across 3 reviews. Results vary a lot, probably because the tests differ [US] |
| Display Brightness | 90–98% across 3 reviews [US] |
| PWM Amplitude | 28–100% across 3 reviews. Results vary a lot, probably because the tests differ [US] |
| PWM Frequency | 960–4,650 hz across 3 reviews. Results vary a lot, probably because the tests differ [US] |
🌡️ Heat and Noise
| Measurement | Result |
|---|---|
| fan noise | 43–50 db across 2 reviews [US] |
| max. fan noise | 38.4–44.4 db(a) across 2 reviews [US] |
| CPU temperature high end | 86 c (one review) [US] |
| CPU temperature peak | 72 c (one review) [US] |
🔬 Technical takeaway
- Battery Life: typically 12.88 h (9.75–17 across 8 reviews). Results vary a lot, probably because the tests differ [US].
- Display Brightness: typically 944 nits (550–1,600 across 7 reviews). Results vary a lot, probably because the tests differ [US].
- Framerate: typically 80.43 fps (56–100 across 6 reviews). Results vary a lot, probably because the tests differ [US].
- 3DMark Time Spy: 10,164–11,840 across 3 reviews.
Numbers come from the reviewers' own tests and spec lists. Test conditions differ between sources.
⚡ Where Reviewers Disagreed
- Value for Money: 3 praised it, 6 criticised it, 14 were mixed (23 sources evaluated it).
- Webcam: 1 praised it, 2 criticised it (3 sources evaluated it).
- Battery Life: typically 12.88 h (9.75–17 across 8 reviews). Results vary a lot, probably because the tests differ Test conditions differ: mixed use; video playback; productivity based work.
- Display Brightness: typically 944 nits (550–1,600 across 7 reviews). Results vary a lot, probably because the tests differ Test conditions differ: Peak luminance on OLED screen; measured brightness; maximum SDR brightness.
- framerate: typically 80.43 fps (56–100 across 6 reviews). Results vary a lot, probably because the tests differ Test conditions differ: Playing Control Resonant at 1,440p with ultra settings, ray-tracing set to mediu; Playing Control Resonant with lowered graphics settings; Cyberpunk 2077 ray-tracing ultra at native resolution with DLSS and frame-gen.
- Battery Life (drain): 1–86% across 3 reviews. Results vary a lot, probably because the tests differ Test conditions differ: 60 minutes of online Netflix playback; overnight standby over 14 hours; PCMark 10 gaming battery life test.
- Display Brightness: 435–1,059 cd/m² across 3 reviews. Results vary a lot, probably because the tests differ Test conditions differ: Center on Battery; Brightness middle.
- PWM Amplitude: 28–100% across 3 reviews. Results vary a lot, probably because the tests differ Test conditions differ: PWM Amplitude.
- PWM Frequency: 960–4,650 hz across 3 reviews. Results vary a lot, probably because the tests differ
- score: 3,895–7,004 points across 3 reviews. Results vary a lot, probably because the tests differ Test conditions differ: Geekbench 6's GPU benchmark; UL Procyon's AI Computer Vision 2 benchmark; Procyon's AI Image Generation test.
🧩 Other Things Reviewers Mentioned
Framerate (6 of 25 sources)
| Measurement | Result |
|---|---|
| framerate | typically 80.43 fps (56–100 across 6 reviews). Results vary a lot, probably because the tests differ [US] |
Black level (3 of 25 sources)
| Measurement | Result |
|---|---|
| Black Level | 0.03–0.61 cd/m² across 2 reviews. Results vary a lot, probably because the tests differ [US] |
Gamma (3 of 25 sources)
| Measurement | Result |
|---|---|
| Gamma | 2.18–2.22 across 3 reviews [US] |
CCT (3 of 25 sources)
| Measurement | Result |
|---|---|
| CCT | 6,086–6,547 k across 3 reviews [US] |
Score (3 of 25 sources)
| Measurement | Result |
|---|---|
| score | 3,895–7,004 points across 3 reviews. Results vary a lot, probably because the tests differ [US] |
Webcam (3 of 25 sources)
Contrast ratio (2 of 25 sources)
maximum AS SSD Seq Read Test (2 of 25 sources)
| Measurement | Result |
|---|---|
| maximum AS SSD Seq Read Test | 201.4–714 mb/s across 2 reviews. Results vary a lot, probably because the tests differ [US] |
🧮 How We Got This Score
In short: each of the 25 reviews is turned into a 0 to 10 number, stronger evidence counts for more, and the numbers are averaged.
- 8 reviews gave their own numeric score, and those count extra. The others are scored from their overall tone.
- First impressions and reviews without hands-on testing count less.
- If 80%+ of reviews lean the same way, the score moves by 0.5. This time: +0.5 (84% of sources positive (threshold 80%)).
- 84% of reviews lean positive, and scores are close together (spread 1.3). Agreement: High.
- How we got there: score 8.3/10, value signal 4.7/10 from 23 reviews, evidence strong (25 reviews, 25 hands-on).
- Reviews are dated Oct 2025 to Oct 2026.
The arithmetic, for the curious
| Review type | Reviews | Avg value | Total weight | Value × weight |
|---|---|---|---|---|
| Numeric reviewer score | 8 | 8.1 | 11.55 | 93.60 |
| Strongly positive review | 6 | 8.5 | 5.70 | 48.45 |
| Mildly positive review | 7 | 7.5 | 6.70 | 50.25 |
| Mixed review | 4 | 5.0 | 1.70 | 8.50 |
| All reviews | 25 | 25.65 | 200.80 |
Raw average = 200.80 ÷ 25.65 = 7.8. Consensus adjustment +0.5 gives the final 8.3.
Calculated in code from structured data, with no manual adjustments.
How much to trust this
What these conclusions are based on
Based on 25 usable reviews: 25 hands-on, 5 first impressions, 8 with a numeric score, 24 with measured results. Evidence strength: strong.
Versions covered: 20-core Grace CPU, Blackwell integrated GPU, 32GB unified memory, 1TB SSD; 20-core N1X, 64GB LPDDR5X-9400, 1TB Gen4 SSD; 18 core Nvidia N1X processor, 32GB unified memory, 512GB SSD; 6144-core GPU, 20-core CPU, 32GB RAM; 32 GB RAM, RTX Spark 20-Core; 3K Nano Black with 64GB RAM and 1TB SSD; 4K OLED with 128GB RAM and 2TB SSD. These reviews mix variants or markets, so check which one you are buying.
Reviewer recommendations: 11 recommended, 14 conditional, 0 not recommended.
How sources were chosen: every matching review in our collection is used, newest first; 8 were left out because they were about a different product or version.
No source rated it negatively, so the weak spots listed on this page are where the real differences show up.
Reviewers who gave a numeric score averaged 8.1/10, ranging from 6.5 to 9.5.
📚 Sources Analysed
24 of 25 reviews could be matched to a site (17 in total).
Reviews by market: US 16 · 9 without a stated market. Prices, mileage and range figures follow each reviewer's own market.
Last updated: 1 Nov 2026 · based on 25 reviews dated Oct 2025 – Oct 2026.