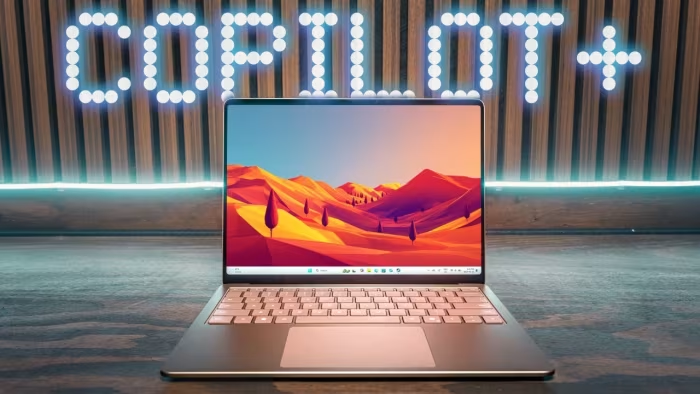
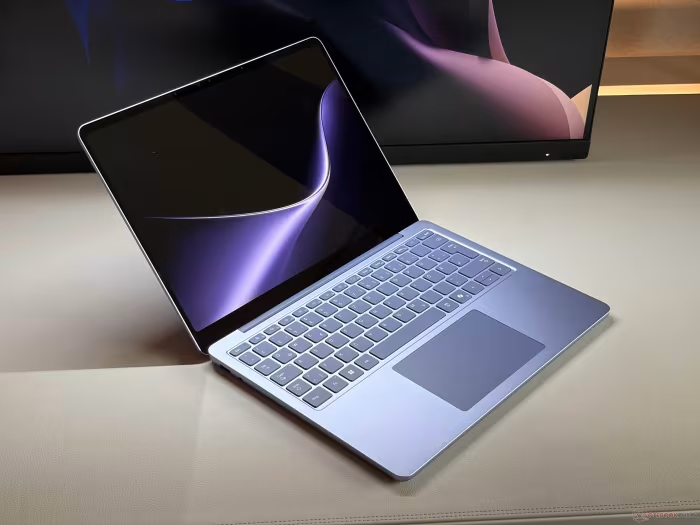
Microsoft Surface Laptop 13 Review
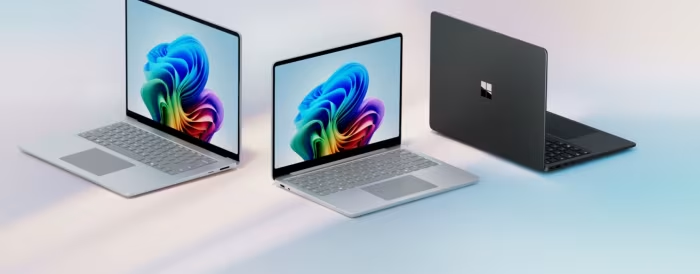
Consensus Review · 24 independent sources
Microsoft Surface Laptop 13
Worth considering, with trade-offs. Reviewers mostly like it, but find the price hard to justify.
⚡ The Short Version
The Microsoft Surface Laptop 13 is a sleek, premium ultraportable that excels with its sturdy metal build, comfortable keyboard, and long-lasting battery. It feels like a reliable daily driver for office or school tasks, though you should be mindful of the high price and the fact that the RAM can't be upgraded later. Reviewers find the value debatable given the cost, so it's worth weighing how much you prioritize portability and build quality against your budget.
Things to weigh: Thermals & Noise · Value for Money (reviewers disagree)
Reviews by market: US 11 · India 6 · Europe 1 · 6 without a stated market. Prices, mileage and range figures follow each reviewer's own market.
Confidence: high · 24 reviews · 16 hands-on
👍 Microsoft Surface Laptop 13 pros and cons
👍 Pros
- Under one kg weight & Portability
- Comfortable keyboard
- Metal chassis build Quality
- Long runtime battery Life
- Top tier audio speakers
👎 Cons
- Arm compatibility varies software & Features
- Keyboard gets hot thermals & Noise
- Ordinary 1080p webcam
- Mediocre gaming Performance
- RAM is soldered and cannot be upgraded
💰 Value for Money Analysis
The value for money is considered fair because the base model starts with 16 GB of RAM, which drives up the initial cost compared to entry-level alternatives.
17 of 24 sources commented on price or value.
📊 What Reviewers Say — Feature by Feature
14 features discussed across 24 sources. Each score blends what reviewers said about that feature with the overall score, so a feature with few mentions stays close to the overall verdict.
🔀 Rivals to compare
- MacBook Pro (named by 5 of 24) [rival] Traditional creator favorite, compared for form factor and performance. Popular alternative for power users, though top configurations cost significantly more.
- Apple MacBook Air 13 M5 (named by 3 of 24) [rival] Offers superior SoC performance and battery runtimes. Offers traditional macOS ecosystem with strong performance. Reviewers favoured Microsoft Surface Laptop 13 for multicore.
- Apple MacBook Air 13-Inch (named by 2 of 24) [rival] Competes as a premium productivity laptop. Better overall graphics and display performance
- Apple MacBook Pro 16 (named by 2 of 24) [rival] Offers better overall Mini-LED implementation and longer battery life. Offers traditional pro laptop performance and app ecosystem. Reviewers favoured it for display.
- Asus ProArt P16 (named by 2 of 24) [rival] Thinner, lighter, and features a superior OLED panel. Lighter competitor used for comparative hardware evaluation. Reviewers favoured it for display.
- Dell Pro 7 14 (named by 2 of 24) [rival] Another enterprise alternative in the office laptop space. Alternative premium productivity laptop Reviewers favoured it for productivity.
- HP Omnibook 5 14 (named by 2 of 24) [cheaper] Offers superior overall performance at a lower price for consumers. Offers superior overall performance at a lower price for freelancers and solopreneurs
- Lenovo ThinkPad X1 Carbon Gen 14 (named by 2 of 24) [premium] Provides a top-quality ThinkPad experience for select employees
Reasons are the reviewers' own. Spellings of the same product are merged.
🛒 Is it right for you?
✅ Buy this if…
- You're an IT department buying in bulk for office staff
- You want a nearly silent laptop with great battery life
- You value premium build quality and comfortable input devices
- You need a premium ultraportable for daily office and school tasks
⚠️ Skip this if…
- You need a high refresh rate display for smooth visuals
- You plan to upgrade or repair internal components yourself
- You require heavy gaming or professional 3D rendering capabilities
- Your essential applications or peripherals lack Windows on ARM support
Is the Microsoft Surface Laptop 13 worth buying?
Strengths, weaknesses and who it suits
🎯 Who This Product Is For
Reviewer recommendations for different target audiences and use cases.
Real-world findings
Test results, marketing claims and known problems
🔍 Claims vs real life
| Claim | Claimed | Measured by reviewers | Verdict |
|---|---|---|---|
| Display Brightness | 2,000 nits | 273.5–1,500 nits (typically 619.5) across 4 reviews [US] | Falls short |
| Sequential Read | 10,244 mb/s | not measured | Not independently tested |
| Sequential Write | 6,898 mb/s | not measured | Not independently tested |
| Weight & Portability | 4.41 lb | not measured | Not independently tested |
Claims are the manufacturer's figures as quoted by reviewers. Measured values are what reviewers recorded themselves; test conditions differ between sources.
🔋 Real-World Battery
| Measurement | Result |
|---|---|
| Battery Life | typically 11.25 h (3–14.76 across 6 reviews). Results vary a lot, probably because the tests differ [US] |
| Battery Life | 37.03 hours:minute, and all 2 reviews agree [US] |
| Battery Life | 95 Wh (one review) [US] |
🔌 Power Draw and Efficiency
| Measurement | Result |
|---|---|
| Power Consumption Idle | 2 watt (one review) |
| Power Consumption Off | 0.28 watt (one review) |
| Power Consumption Standby | 0.38 watt (one review) |
| power draw peak | 227 watts (one review) [US] |
⚠️ Things to Check Before Buying
- Touchscreen: reviews disagree (yes vs no), so check the exact version you are ordering.
- Facial Recognition: reviews disagree (yes vs no), so check the exact version you are ordering.
- SD Card Reader: reviews disagree (yes vs no), so check the exact version you are ordering.
- Not included: OLED, Windows Hello.
- These reviews cover different versions (Intel Core Ultra 5 325, integrated Intel Graphics, 16GB RAM, 512GB SSD; Qualcomm Snapdragon X2 Plus X2P-42-100, 16 GB RAM, 512 GB SSD; 128 GB of unified LPDDR5X memory), so check which one you are buying.
- Confirmed by reviewers: Headphone Jack, Fingerprint Reader, Charger In Box.
⚠️ Known problems
Confirmed by 2+ sources
- Keyboard gets hot under sustained load. (moderate · unresolved · 2 sources)
Reported by one source (not confirmed)
- Complicated access to components and M.2-2242 SSD (moderate · unresolved · 1 source)
- Cooling performance with single fan is not great and sustained performance suffers (moderate · unresolved · 1 source)
- Gets hot under the hinge when running flat out and plugged in (moderate · unresolved · 1 source)
- Insufficient power adapter under load causing battery usage during peak loads (moderate · unresolved · 1 source)
- Loud pops and bangs from the built-in speakers sounding like firecrackers (moderate · workaround · 1 source)
- Meh battery life (moderate · unresolved · 1 source)
- Not all Android apps are working or compatible (moderate · unresolved · 1 source)
- Screen is really reflective and suffers from motion blur and HDR blooming (moderate · unresolved · 1 source)
- Screen unreadable in sunlight (moderate · unresolved · 1 source)
How it compares
Alternatives and the previous model
The Surface Laptop 13 is a great, highly portable daily driver with a premium build, though its high price and thermal limitations make it a trade-off for most users.
Most-named alternative: MacBook Pro (named by 5 of 24 sources)
Nerd corner
Feature-by-feature chart, measurements, specs and the score maths. Skip this part if you only want the answer.
Technical note: Performance results across benchmarks vary significantly, with Geekbench 6.7 multi-core scores ranging from 6,354 to 16,943 points. Thermal management is mixed, as some reviewers noted the keyboard gets warm under load while others found the fan operation to be nearly silent.
⚙️ Performance
| Measurement | Result |
|---|---|
| Geekbench 6.7 / Multi-Core | 6,354–16,943 points across 2 reviews. Results vary a lot, probably because the tests differ |
| Geekbench 6.7 / Single-Core | 1,585–2,980 points across 2 reviews. Results vary a lot, probably because the tests differ |
| 3DMark / Steel Nomad Light Score | 1,897 points (one review) |
| 3DMark / Wild Life Extreme | 4,728 points (one review) |
🖥️ Display
| Measurement | Result |
|---|---|
| Display Brightness | 511–1,059 cd/m² across 4 reviews. Results vary a lot, probably because the tests differ [US] |
| Display Brightness | 273.5–1,500 nits across 4 reviews. Results vary a lot, probably because the tests differ [US] |
| Display Brightness | 90–95% across 2 reviews [US] |
| PWM Amplitude | 44–100% across 2 reviews. Results vary a lot, probably because the tests differ [US] |
| PWM Frequency | 720–4,650 hz across 2 reviews. Results vary a lot, probably because the tests differ [US] |
🌡️ Heat and Noise
| Measurement | Result |
|---|---|
| Idle Maximum Temperature | 37.2 °c (one review) |
| Load Maximum Temperature | 38.9 °c (one review) |
| Max Fan Noise | 38.4 db(a) (one review) [US] |
🔬 Technical takeaway
- Battery Life: typically 11.25 h (3–14.76 across 6 reviews). Results vary a lot, probably because the tests differ [US].
- Display Brightness: 511–1,059 cd/m² across 4 reviews. Results vary a lot, probably because the tests differ [US].
- Display Brightness: 273.5–1,500 nits across 4 reviews. Results vary a lot, probably because the tests differ [US].
- Black Level: 0.29–0.61 cd/m² across 3 reviews. Results vary a lot, probably because the tests differ [US].
- Check before ordering: Touchscreen differs between reviews.
Numbers come from the reviewers' own tests and spec lists. Test conditions differ between sources.
⚡ Where Reviewers Disagreed
- Value for Money: 3 praised it, 2 criticised it, 12 were mixed (17 sources evaluated it).
- Thermals & Noise: 2 praised it, 2 criticised it, 1 were mixed (5 sources evaluated it).
- Gaming Performance: 2 praised it, 1 criticised it (3 sources evaluated it).
- Battery Life: typically 11.25 h (3–14.76 across 6 reviews). Results vary a lot, probably because the tests differ Test conditions differ: Wi-Fi test at 150 nits; Maximum brightness; web browsing on 13.8-inch model.
- Display Brightness: 511–1,059 cd/m² across 4 reviews. Results vary a lot, probably because the tests differ Test conditions differ: Maximum brightness; Average brightness; Brightness middle.
- Display Brightness: 273.5–1,500 nits across 4 reviews. Results vary a lot, probably because the tests differ Test conditions differ: peak in SDR, as tested; peak in HDR, as tested; at 50% brightness.
- Black Level: 0.29–0.61 cd/m² across 3 reviews. Results vary a lot, probably because the tests differ Test conditions differ: Black Level.
- Contrast: 1,250–1,852 :1 across 2 reviews. Results vary a lot, probably because the tests differ
- Geekbench 6.7 / Multi-Core: 6,354–16,943 points across 2 reviews. Results vary a lot, probably because the tests differ
- Geekbench 6.7 / Single-Core: 1,585–2,980 points across 2 reviews. Results vary a lot, probably because the tests differ
🧩 Other Things Reviewers Mentioned
Ports & Connectivity (9 of 24 sources)
| Measurement | Result |
|---|---|
| Wi-Fi Receive Speed | 2,038–2,228 mbit/s across 2 reviews [US] |
| Wi-Fi Transmit Speed | 2,266–2,440 mbit/s across 2 reviews [US] |
Black Level (3 of 24 sources)
| Measurement | Result |
|---|---|
| Black Level | 0.29–0.61 cd/m² across 3 reviews. Results vary a lot, probably because the tests differ [US] |
Gamma (2 of 24 sources)
| Measurement | Result |
|---|---|
| Gamma | 1.99–2.22 across 2 reviews [US] |
CCT (2 of 24 sources)
| Measurement | Result |
|---|---|
| CCT | 6,505–6,913 k across 2 reviews [US] |
Framerate (2 of 24 sources)
| Measurement | Result |
|---|---|
| framerate | 40–99.5 fps across 2 reviews. Results vary a lot, probably because the tests differ [US] |
Response Time Grey 50% / Grey 80% (2 of 24 sources)
| Measurement | Result |
|---|---|
| Response Time Grey 50% / Grey 80% | 2.6–45.7 ms across 2 reviews. Results vary a lot, probably because the tests differ |
Response Time Black / White (2 of 24 sources)
| Measurement | Result |
|---|---|
| Response Time Black / White | 0.44–21.5 ms across 2 reviews. Results vary a lot, probably because the tests differ |
Contrast (2 of 24 sources)
| Measurement | Result |
|---|---|
| Contrast | 1,250–1,852 :1 across 2 reviews. Results vary a lot, probably because the tests differ |
🧮 How We Got This Score
In short: each of the 24 reviews is turned into a 0 to 10 number, stronger evidence counts for more, and the numbers are averaged.
- 8 reviews gave their own numeric score, and those count extra. The others are scored from their overall tone.
- First impressions and reviews without hands-on testing count less.
- If 80%+ of reviews lean the same way, the score moves by 0.5. This time: 0 (no direction reached 80% agreement).
- 71% of reviews lean positive, and scores are close together (spread 1.6). Agreement: Moderate.
- How we got there: score 7.5/10, value signal 5.2/10 from 17 reviews, evidence strong (24 reviews, 16 hands-on).
- Reviews are dated Nov 2024 to Oct 2026.
The arithmetic, for the curious
| Review type | Reviews | Avg value | Total weight | Value × weight |
|---|---|---|---|---|
| Numeric reviewer score | 8 | 7.9 | 12.00 | 95.25 |
| Strongly positive review | 4 | 8.5 | 4.00 | 34.00 |
| Mildly positive review | 6 | 7.5 | 6.00 | 45.00 |
| Mixed review | 5 | 5.0 | 2.35 | 11.75 |
| Mildly negative review | 1 | 3.5 | 1.00 | 3.50 |
| All reviews | 24 | 25.35 | 189.50 |
Raw average = 189.50 ÷ 25.35 = 7.5. Consensus adjustment 0 gives the final 7.5.
Calculated in code from structured data, with no manual adjustments.
How much to trust this
What these conclusions are based on
Based on 24 usable reviews: 16 hands-on, 1 first impressions, 8 with a numeric score, 13 with measured results. Evidence strength: strong.
Versions covered: Intel Core Ultra 5 325, integrated Intel Graphics, 16GB RAM, 512GB SSD; Qualcomm Snapdragon X2 Plus X2P-42-100, 16 GB RAM, 512 GB SSD; 128 GB of unified LPDDR5X memory; 13.8-inch configuration with Snapdragon X2 Plus processor, 16GB RAM, and 512GB SSD; 20-core CPU, 6,144 GPU cores, 32 GB of RAM, 1 TB SSD; Nvidia RTX Spark N1X 20-Core, 64 GB RAM, 1 TB SSD. These reviews mix variants or markets, so check which one you are buying.
Reviewer recommendations: 6 recommended, 10 conditional, 0 not recommended.
How sources were chosen: every matching review in our collection is used, newest first; 17 were left out because they were about a different product or version.
Reviewers who gave a numeric score averaged 7.9/10, ranging from 6.0 to 9.0.
📚 Sources Analysed
All 24 reviews were matched to 18 different sites.
Reviews by market: US 11 · India 6 · Europe 1 · 6 without a stated market. Prices, mileage and range figures follow each reviewer's own market.
Last updated: 1 Nov 2026 · based on 24 reviews dated Nov 2024 – Oct 2026.